1. Total Growth and the Simple Yearly Average
Take a starting value of ₹1,00,000 and an ending value of ₹1,80,000 after 5 years. The total growth is ₹80,000 on ₹1,00,000, or 80.00%.
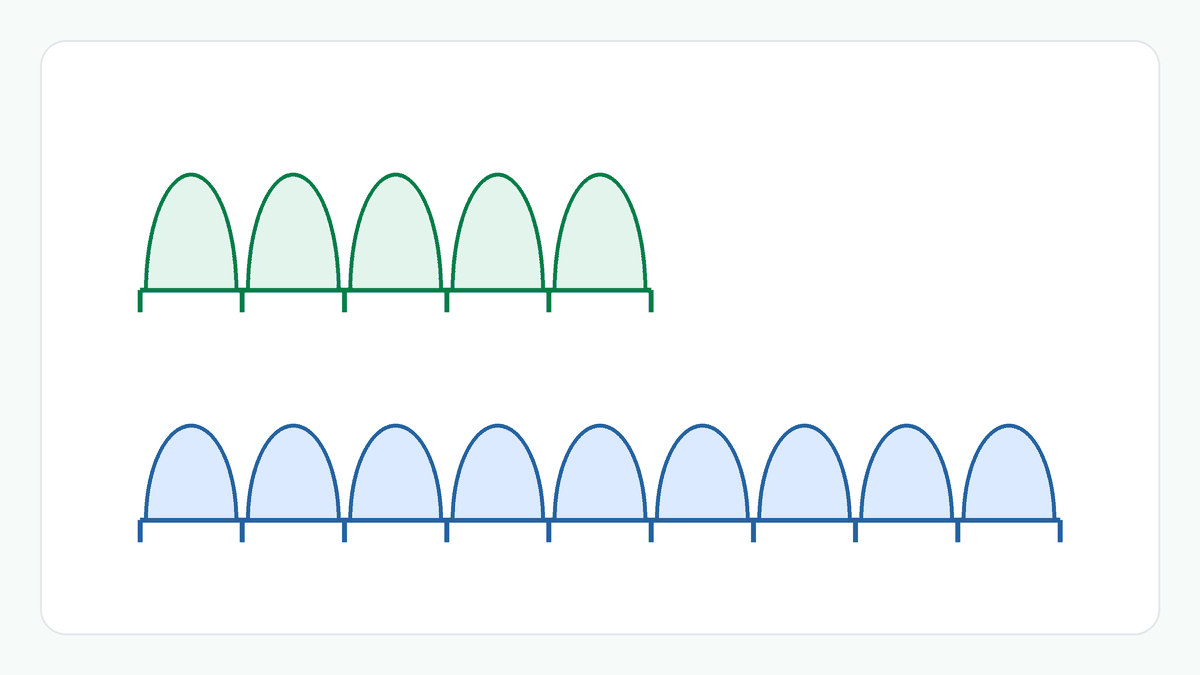
Dividing the total growth by the number of years gives 16.00% a year. In this calculator that figure is called the simple yearly average: the total growth divided by the years. It is easy to compute, but it treats the growth as if the same ₹16,000 were added each year.
2. What CAGR Asks
The compound annual growth rate asks a different question: what single yearly rate, compounded each year, would turn ₹1,00,000 into ₹1,80,000 over 5 years?
The answer is about 12.47% a year. Applied to ₹1,00,000, that is about ₹12,475 of growth in the first year. Each later year grows from a larger base.
3. Why the Two Differ
The simple yearly average spreads the total growth into five equal parts of ₹16,000, each measured against the original ₹1,00,000. Nothing compounds, so every year adds the same amount.
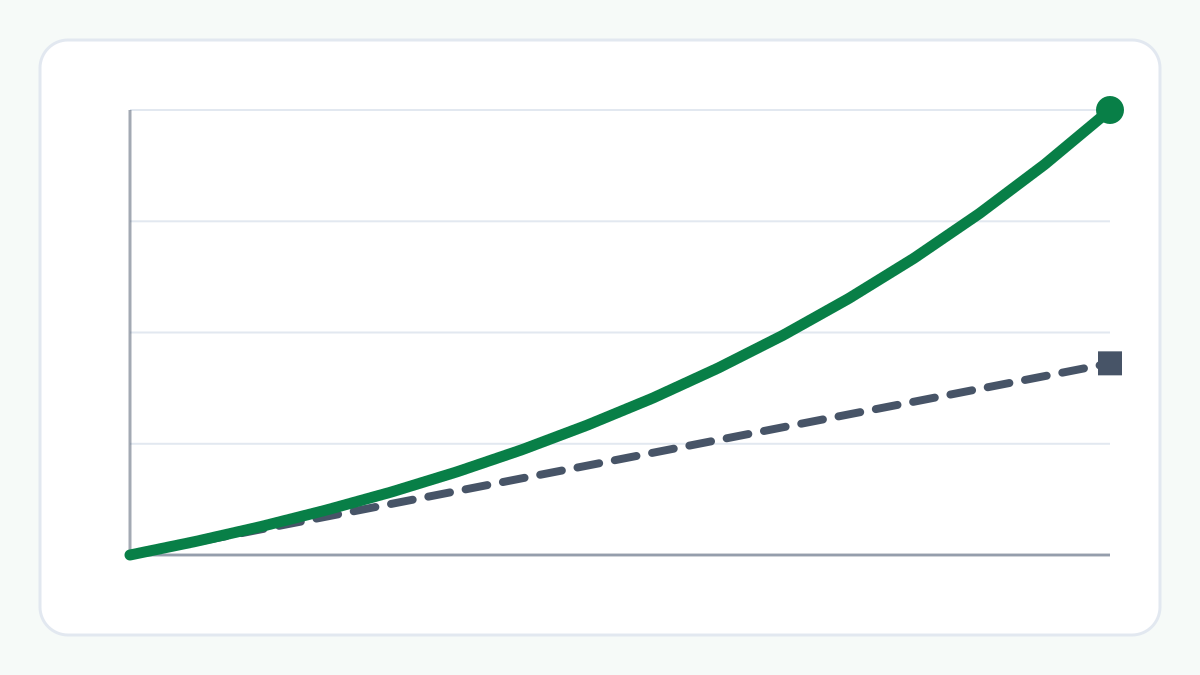
Compounding works differently. Each year's growth is a share of the value the year before, so the rupee amounts rise: about ₹12,475 in the first year and about ₹19,964 in the fifth. Both routes end at ₹1,80,000, but the compounded one needs a lower rate to get there.
These yearly amounts are a mathematical construction that connects the two values. They are not recorded yearly results, and the value did not necessarily grow smoothly each year.
To see that 16% is not the compounded rate, compound it: ₹1,00,000 growing at 16% a year for 5 years reaches about ₹2,10,034, not ₹1,80,000.
4. How the Gap Behaves
For growth over more than one year, the simple yearly average is higher than the CAGR, and the gap widens as the period gets longer or the total growth gets larger. Here the difference is 16.00% less 12.47%, about 3.53 percentage points.
The two figures agree only when there is no growth, or when the period is exactly one year.
5. What This Does Not Tell You
CAGR assumes one starting value and one ending value, with no money added or withdrawn in between. It is the constant yearly rate that would connect them. The actual year-by-year path may have been very different, and a past CAGR does not mean the same rate will happen again.
Regular investing, such as a SIP, is not a lump sum, so CAGR does not suit it. Fees, tax, inflation and dividends not already in the ending value are not included. This is arithmetic on the numbers you enter, not a forecast or advice.
Example: ₹1,00,000 to ₹1,80,000 Over 5 Years
Total growth: 80.00%. Growth multiple: 1.80×. Simple yearly average: 16.00%. CAGR: about 12.47%.
Compounded at the CAGR, the first year adds about ₹12,475 and the fifth about ₹19,964. Compounding 16% for 5 years would reach about ₹2,10,034.
The Bigger Picture
Total growth tells you how much a value changed. The CAGR tells you the equal yearly rate that would connect the two values. Dividing the first by the number of years is a shortcut that overstates the second.
Things to Consider
- Do not divide the total growth by the years and call it the yearly rate.
- Read the CAGR as the equal compounded yearly rate between two values.
- Remember that a past CAGR is not a forecast.
- Remember that CAGR does not suit money added or withdrawn along the way.
Try the CAGR Calculator
Enter a starting value, an ending value and a period to see the CAGR next to the total growth, the growth multiple and the simple yearly average.
Frequently Asked Questions
Why is the CAGR lower than the total growth divided by the years?
Dividing by the years spreads the growth evenly without compounding. The CAGR is the equal yearly rate that compounds to the same ending value, and that rate is lower than the simple division.
Is the simple yearly average an average of yearly returns?
No. In this calculator it is only the total growth divided by the number of years. It is not built from any yearly figures, because the calculator takes none.
Does a CAGR mean the value grew by that much every year?
No. It is the constant yearly rate that would connect the two values. The actual year-by-year growth may have been quite different.
How were the figures calculated?
With the CAGR Calculator, using a starting value of ₹1,00,000, an ending value of ₹1,80,000 and a period of 5 years. You can reproduce them by entering the same values.
Related Articles
Explore more practical guides from ToolZen Hub.