1. Two Records, Two Periods
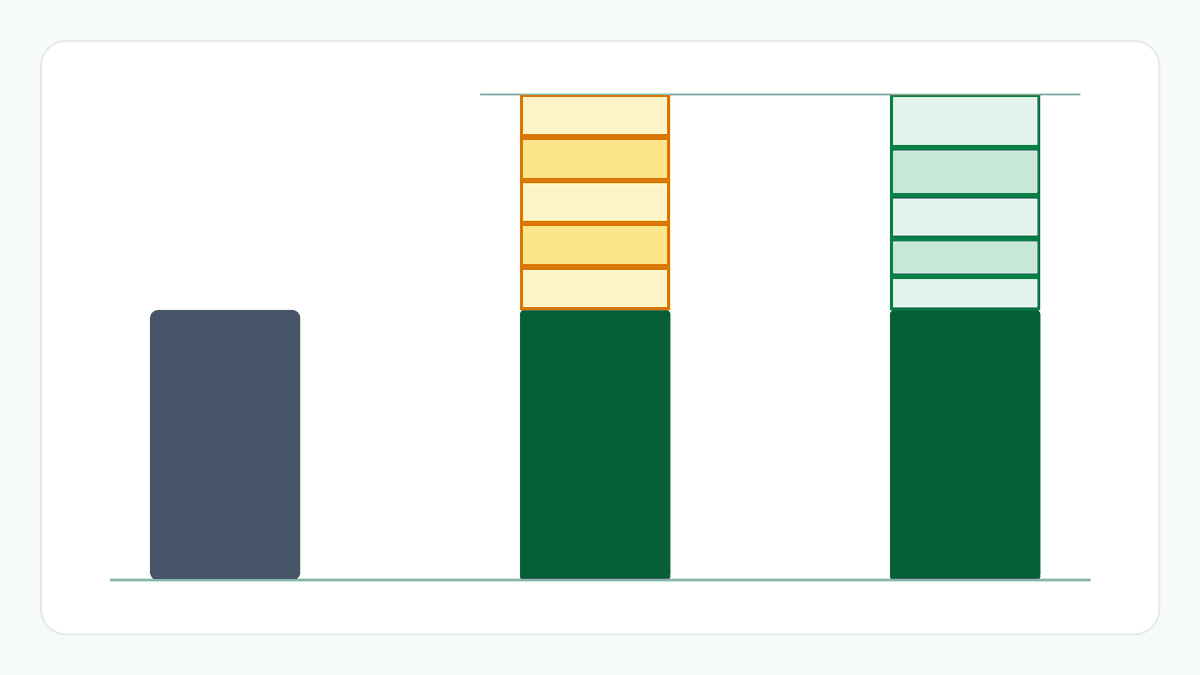
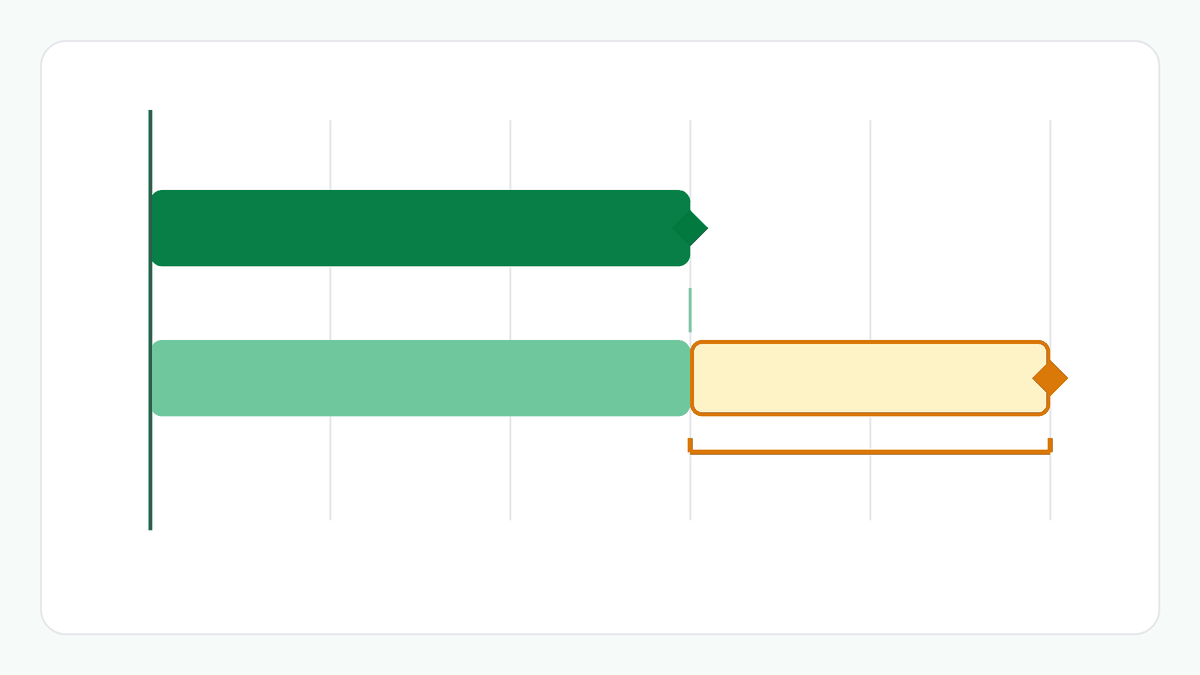
Case A started at ₹1,00,000 and ended at ₹1,80,000 after 5 years. Case B started at ₹1,00,000 and ended at ₹2,40,000 after 9 years.
Comparing the ending values alone leaves out how long each took. Comparing the total growth alone leaves it out too.
2. The Total Gain Points One Way
Case A's total growth is 80.00% and its growth multiple is 1.80×. Case B's total growth is 140.00% and its multiple is 2.40×. By total gain, case B is larger.
That is partly because it had 4 more years to grow, so the total gain on its own is not a like-for-like comparison.
3. The Yearly Rate Points the Other
The compound annual growth rate puts each case on a yearly footing. Case A's is about 12.47%. Case B's is about 10.22%, lower by about 2.26 percentage points.
Dividing each total growth by its years gives 16.00% for case A and 15.56% for case B. Those simple yearly averages are close together and miss the gap, because they ignore compounding and the different lengths of time.
4. Why the Period Matters
Think of each case as a chain of equal yearly steps. Case A takes 5 steps, each about 12.47% of the value before it. Case B takes 9 steps, each about 10.22%. B's steps are smaller, but there are more of them, so it ends higher.
These steps are the equivalent yearly rates, a mathematical construction. They are not recorded yearly results for either case, and a lower rate does not make a case worse, or a higher rate better.
A bigger gain over a longer time is therefore not the same as a higher yearly rate. The CAGR is the figure that lets the two be read side by side.
5. What This Does Not Tell You
The CAGR puts the two cases on a yearly footing, but it says nothing about what either did outside its own period, or how the money was used. It assumes one starting value and one ending value with nothing added or withdrawn.
Fees, tax, inflation and dividends not already in the ending value are not included, and a past CAGR is not a forecast. This article does not say which case is the better investment. It is arithmetic on the numbers shown, not advice.
Example: ₹1,80,000 After 5 Years Against ₹2,40,000 After 9 Years
Case A: ₹1,00,000 to ₹1,80,000 over 5 years. Total growth 80.00%, multiple 1.80×, simple yearly average 16.00%, CAGR about 12.47%.
Case B: ₹1,00,000 to ₹2,40,000 over 9 years. Total growth 140.00%, multiple 2.40×, simple yearly average 15.56%, CAGR about 10.22%. The CAGR difference is about −2.26 percentage points.
The Bigger Picture
A total gain says how much a value changed. It does not say how long that took. Putting two cases on a yearly footing is what lets a longer record and a shorter one be read side by side.
Things to Consider
- Check whether the periods match before comparing total growth.
- Read the CAGR, not only the total gain.
- Remember that the CAGR says nothing about what happened outside each period.
- Remember that CAGR does not suit money added or withdrawn along the way.
Try the CAGR Calculator
Enter a second ending value, and optionally a second starting value and period, under Compare With Another Investment to see the two cases side by side.
Frequently Asked Questions
Why does the investment with the larger gain have the lower yearly rate?
Because it took longer. Its growth is spread over 9 years instead of 5, so each yearly step is smaller even though the total is larger.
Does this say which investment is better?
No. It states the differences between the numbers entered. Which matters more depends on your own situation, and fees, tax and how the money was used are not in the figures.
Can I compare cases with different starting values?
Yes. In the CAGR Calculator, enter a starting value for Investment B. If you leave it blank, the first case's starting value is used.
How were the figures calculated?
With the CAGR Calculator, using ₹1,00,000 to ₹1,80,000 over 5 years as the first case and ₹1,00,000 to ₹2,40,000 over 9 years as Investment B. You can reproduce them by entering the same values.
Related Articles
Explore more practical guides from ToolZen Hub.