1. Two Different Amounts
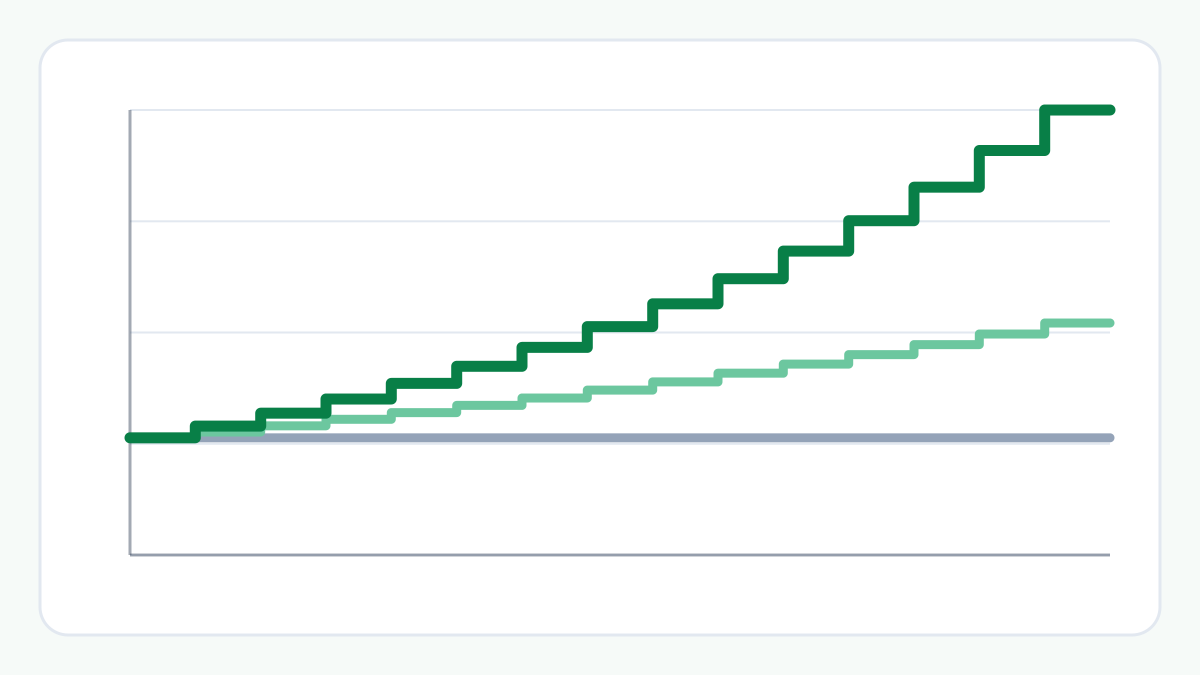
Your investment is the sum of every instalment you put in. It is certain in the sense that you decide it: ₹10,000 a month for 15 years is ₹18,00,000.
The estimated growth is what the return you assume would add on top. It is not decided by you, and it changes whenever the assumed return changes. A projection of ₹41,79,243 therefore means ₹18,00,000 of your own money and about ₹23,79,243 of estimated growth.
Keeping the two apart matters because only the first is under your control. The second is a projection.
2. How the Gap Builds
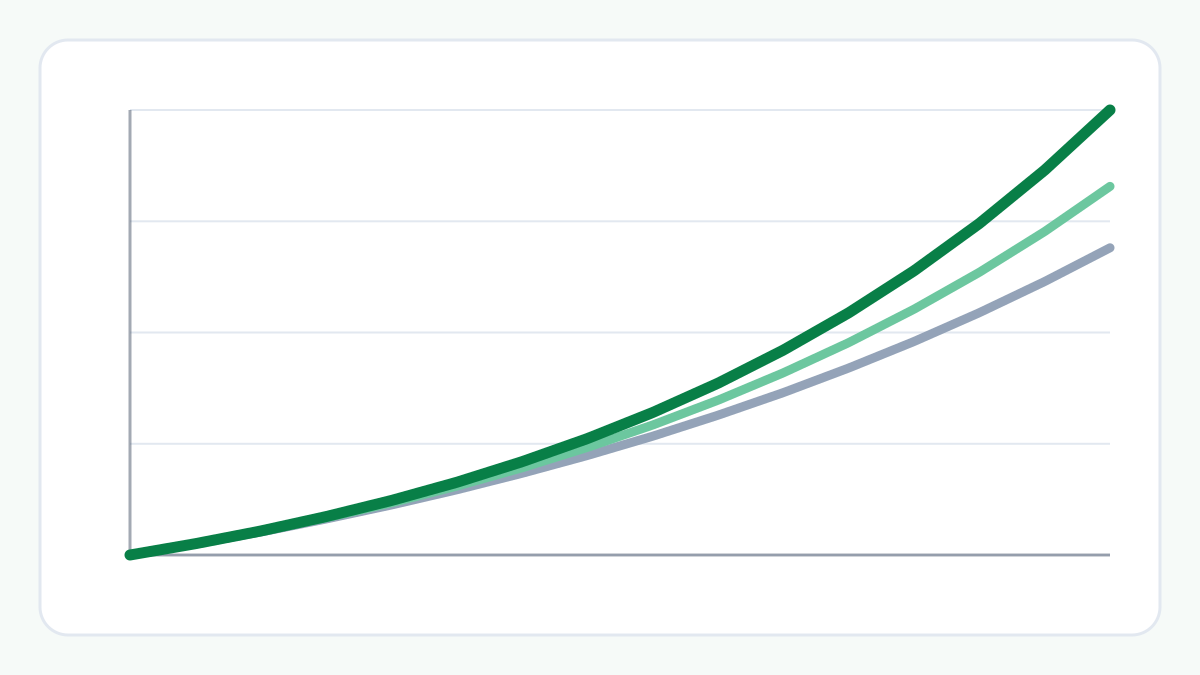
Each instalment is invested at the start of a month and then grows with the rest of the balance. Growth in one month becomes part of the balance that grows in the next, which is compounding.
At the end of year 1 you have invested ₹1,20,000 and the estimated value is about ₹1,26,703, so the estimated growth is only about ₹6,703. At the end of year 5 you have invested ₹6,00,000 and the estimated value is about ₹7,80,824. At the end of year 10 the figures are ₹12,00,000 and about ₹20,65,520.
By year 13 the estimated growth is larger than everything you have invested. At the end of year 15 you have invested ₹18,00,000 and the estimated value is about ₹41,79,243.
3. Why the Last Years Matter
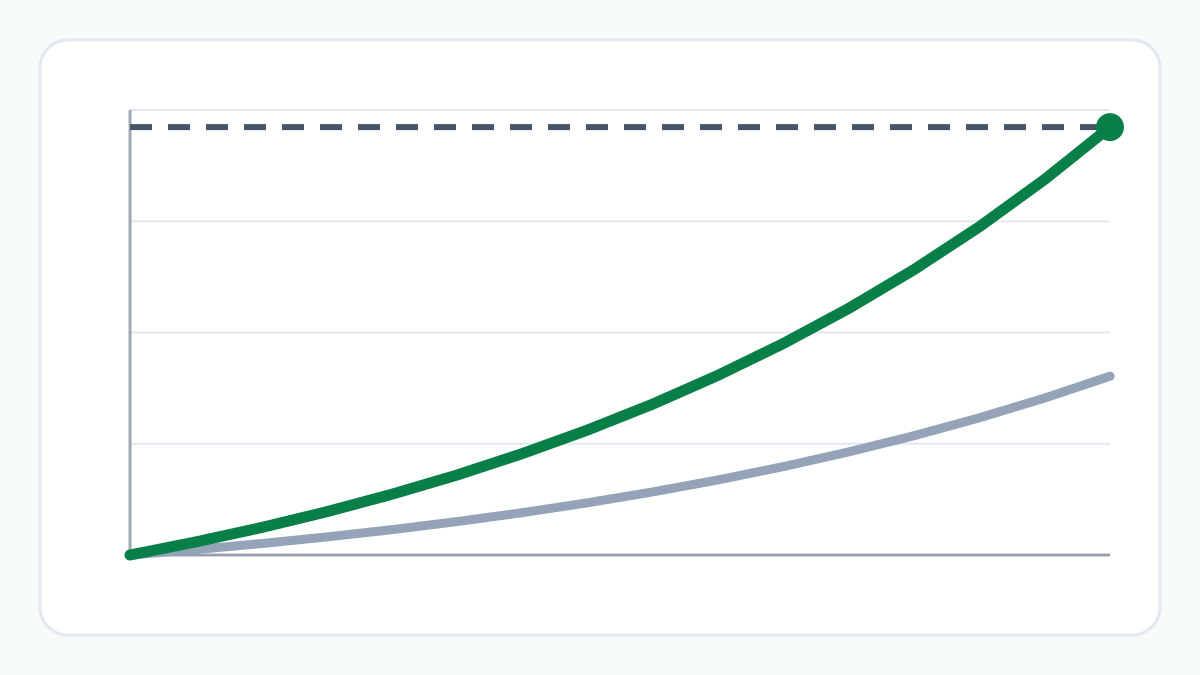
Because growth builds on a larger and larger balance, the later years add the most. In the example, the last three years add about ₹13,91,827 to the estimated value, which is 33.3% of the final figure, even though they are only a fifth of the period.
This is also why stopping early, or starting later, changes the projection by more than the missing instalments alone. It shows how time and the assumed return work together. It does not say what any real investment will do.
4. What This Does Not Tell You
The return in this example, 10% a year, is an assumption chosen to show the method. It is not a forecast and not a promise. Real returns vary from year to year, can be lower than assumed and can be negative, and investments are subject to market risk.
The projection also leaves out taxes, fund charges, exit loads and inflation, so the real value of a result in future years will be lower than the figure suggests. This article gives information, not advice.
Example: ₹10,000 a Month at an Assumed 10% for 15 Years
Invested at the start of each month, with the annual return divided by 12 each month, ₹10,000 a month for 15 years means a total investment of ₹18,00,000 and an estimated value of about ₹41,79,243. The estimated growth is about ₹23,79,243, and the estimated value is 2.32 times the amount invested.
At the end of years 1, 5, 10 and 15 the amounts invested are ₹1,20,000, ₹6,00,000, ₹12,00,000 and ₹18,00,000, and the estimated values are about ₹1,26,703, ₹7,80,824, ₹20,65,520 and ₹41,79,243.
The Bigger Picture
A SIP projection is the sum of what you invest and what an assumed return could add. The first is yours to decide; the second is only an assumption. Seeing them separately, year by year, shows how a projection is built and how much of it rests on the return you choose.
Things to Consider
- Treat the assumed return as a way to explore, not as a prediction.
- Look at the amount invested and the estimated growth separately.
- Remember that taxes, charges and inflation are not in the projection.
- Try more than one return to see how much the result depends on it.
- Remember that investments are subject to market risk.
Try the SIP Calculator
Enter your monthly SIP, an assumed return and a period to see your investment and the estimated growth separately, year by year.
Frequently Asked Questions
Is the estimated value what I will get?
No. It is a projection based on a return you assume. Actual returns can be lower, higher or negative, so the real outcome can differ a great deal.
Why is the growth so small in the first year?
Growth is earned on the balance, and at the start the balance is small. It builds on itself, so the estimated growth is larger in the later years.
Does this include tax and fund charges?
No. The projection leaves out taxes, fund charges, exit loads and inflation, so a real result would be lower than the figure shown.
How were the figures calculated?
With the SIP Calculator, using a standard monthly model: each SIP is invested at the start of the month and the annual return is divided by 12. You can reproduce them by entering the same values.
Related Articles
Explore more practical guides from ToolZen Hub.