CAGR vs Simple Average Growth: Why 80% Growth Over 5 Years Is Not 16% CAGR
Work one example to see why dividing total growth by the years is not the compound annual growth rate, and what the CAGR actually measures.
Find the yearly growth rate that connects a starting and an ending value over a period, see how it differs from a simple average, and compare two investments on the same yearly footing.
Enter the values and the period. Results update as you type.
The CAGR is the single yearly rate that, compounded each year, would turn the starting value into the ending value over the period.
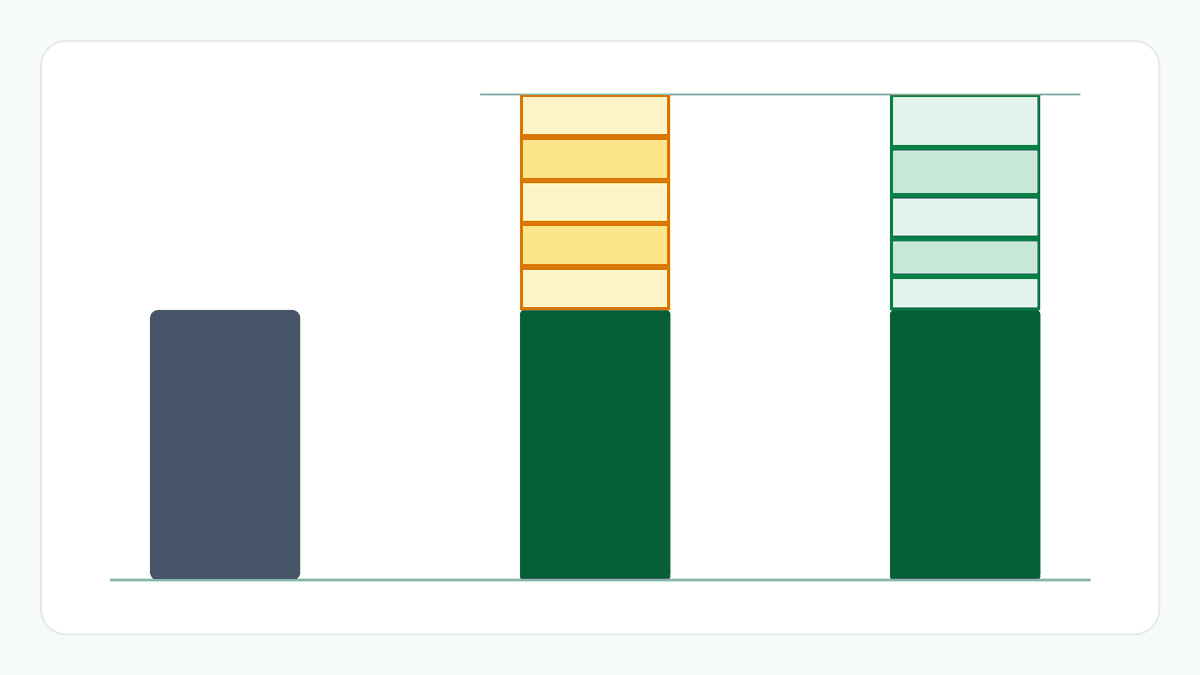
The simple yearly average is the total growth divided by the number of years, nothing more. It ignores compounding, so for growth it is higher than the CAGR, and the gap widens with the period.
Looking ahead uses the same formula with a target. The result is the yearly rate that mathematically connects the two values. It does not say the target is likely or achievable.
Comparing two cases. The CAGR puts cases with different periods on a yearly footing. A larger total gain over a longer period can have a lower yearly rate.
This is arithmetic on the numbers you enter, not advice or a forecast. See the disclaimer.
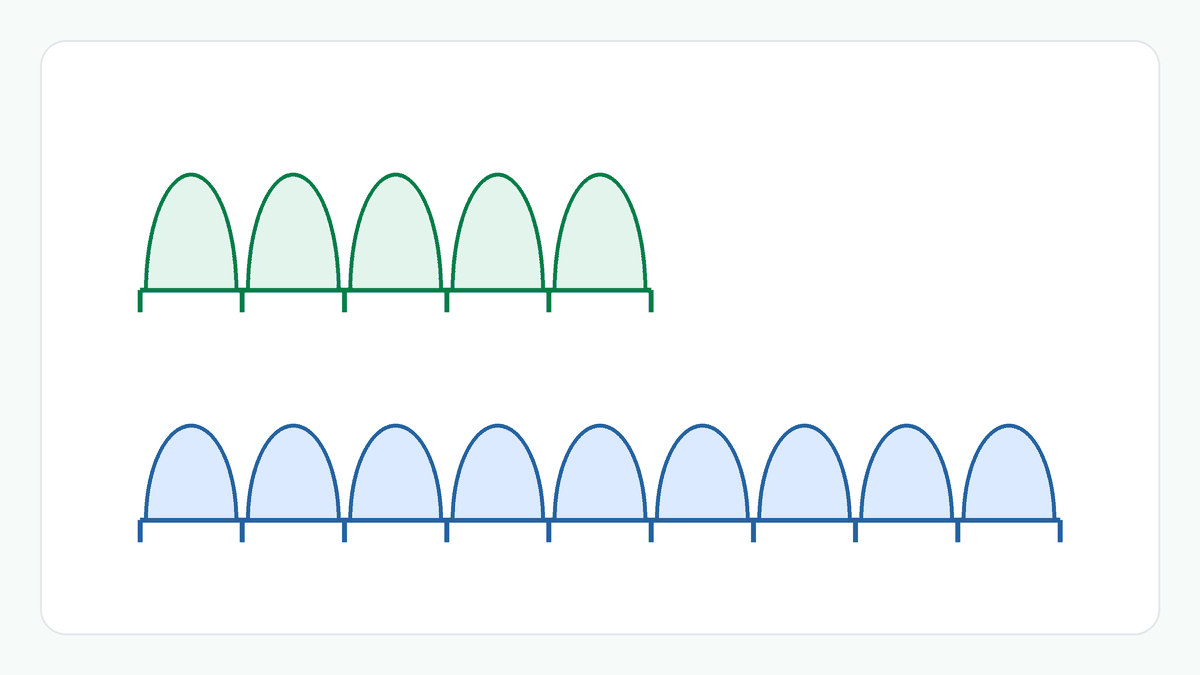
Take ₹1,00,000 growing to ₹1,80,000 over 5 years. The total growth is 80.00%, the growth multiple is 1.80×, and the CAGR is 12.47%. Dividing the total growth by 5 gives 16.00% (the simple yearly average), which is higher because it ignores compounding. Now compare ₹1,00,000 growing to ₹2,40,000 over 9 years: the total growth is larger, 140.00%, but the CAGR is 10.22%, lower than 12.47%, because the growth took longer.
CAGR = (ending value ÷ starting value)1 ÷ years − 1, where the years are the months divided by 12.
Total growth = (ending − starting) ÷ starting. Growth multiple = ending ÷ starting. Simple yearly average = total growth ÷ years.
Dividing the total growth by the years spreads it evenly without compounding. The CAGR is the equal yearly rate that compounds to the same ending value, and that rate is lower than the simple division.
No. CAGR assumes one starting value and one ending value with nothing added or withdrawn. Regular investments need a different measure, and this calculator does not provide one.
It gives the yearly rate that mathematically connects the starting value and the target over the period. It does not say the rate will occur or that the target is achievable.
A second starting value, ending value and period. A blank starting value or period uses the first case's. The table states the differences and does not rank the two.
A rate worked out over less than a year is stretched to a full year and can be misleading, so this calculator starts at one year.