1. Two Quotes, Two Lengths
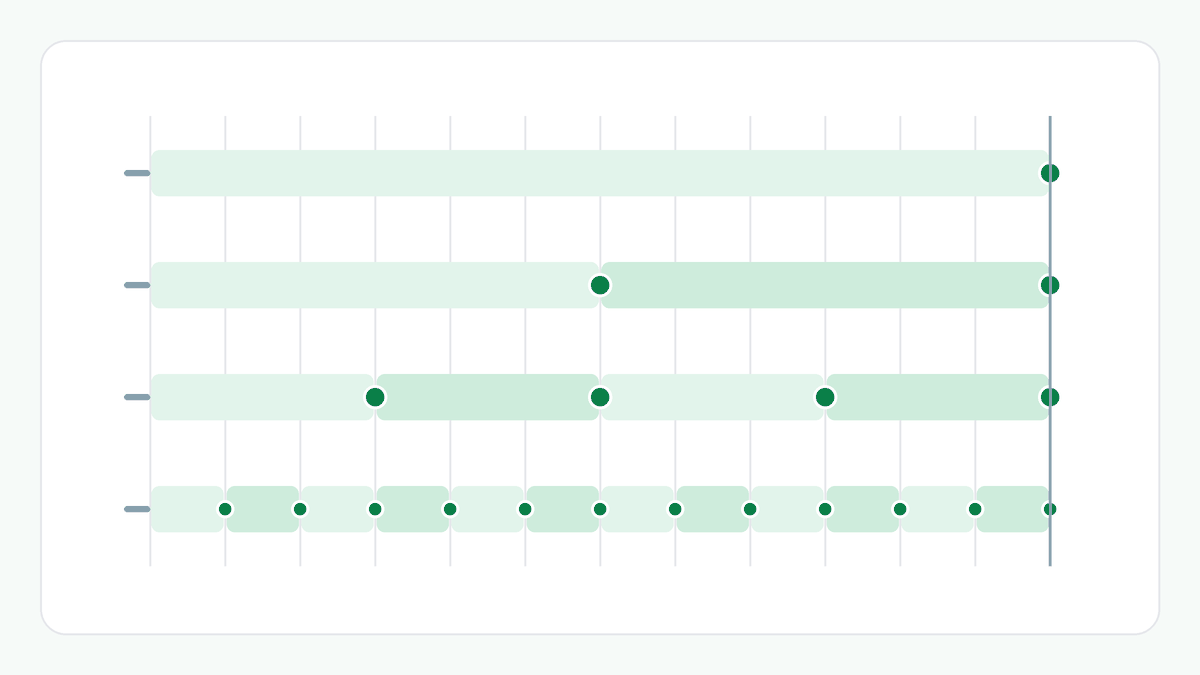
Suppose one quote offers 7.1% a year for 3 years and another offers 6.8% a year for 5 years, both with interest added quarterly, on ₹1,00,000. The first has the higher rate. The second runs for 2 more years.
Comparing the rates alone leaves out how long the money stays in. Comparing the maturity amounts alone leaves it out too.
2. What the Maturities Show
At 7.1% for 3 years the deposit matures to ₹1,23,507.50. At 6.8% for 5 years it matures to ₹1,40,093.85, which is ₹16,586.35 more.
That difference is mostly time. The second deposit stays invested for 2 more years, so it has 2 more years of interest, even though its rate is lower. A larger maturity over a longer tenure does not show that one quote is stronger than the other.
3. Comparing on Equal Time
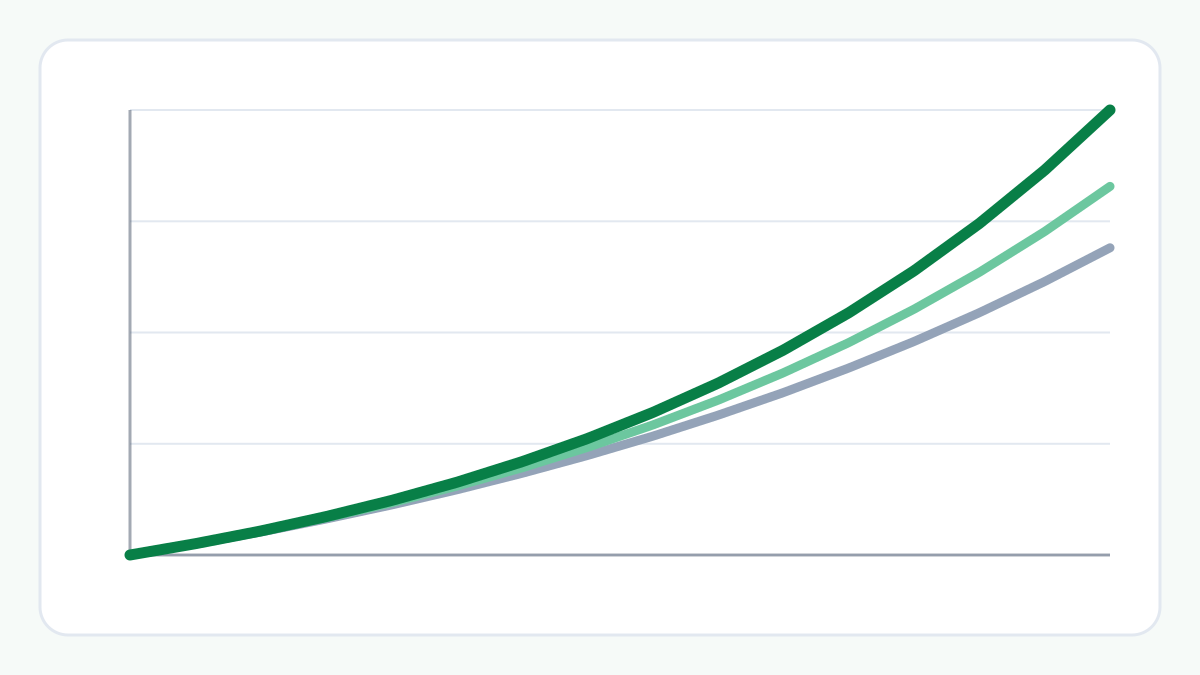
One way to compare is to give both the same tenure. Over 5 years each, 7.1% matures to ₹1,42,174.67 and 6.8% to ₹1,40,093.85. The second is ₹2,080.82 less.
This answers a different question: what the two rates would do over the same time. It is not what happens after the 3-year deposit matures, which depends on what is done with the money then and is not part of these numbers.
4. Yield and Tenure Together
The effective annual yield puts each quote on a yearly footing. Here it is 7.2913% for the 3-year deposit and 6.9754% for the 5-year deposit, a difference of 0.32 percentage points.
Read together with the tenures, the figures say: one deposit has the higher yearly growth, and the other has more years of growth. How to weigh those depends on your own situation, and this article does not weigh them for you.
5. What This Does Not Tell You
The figures assume each rate stays the same and each deposit's interest stays in the deposit. They do not know a bank's compounding dates, day-count conventions, rounding or product terms, so a bank's own maturity can differ.
Tax and TDS, premature withdrawal, payout options, deposit insurance and changes in rates are not included. This is a calculation from the numbers shown, not a bank's quote or advice.
Example: 7.1% for 3 Years Against 6.8% for 5 Years
Option A, 7.1% for 3 years, compounded quarterly: ₹1,23,507.50, effective annual yield 7.2913%. Option B, 6.8% for 5 years: ₹1,40,093.85, yield 6.9754%. Option B matures to ₹16,586.35 more, over 2 more years.
Both for 5 years: 7.1% matures to ₹1,42,174.67 and 6.8% to ₹1,40,093.85, a difference of ₹2,080.82.
The Bigger Picture
A maturity amount answers what a deposit grows to. It does not say how long that took. Putting the tenure and the effective annual yield next to it is what turns two numbers into a comparison.
Things to Consider
- Check whether the tenures match before comparing maturities.
- Read the effective annual yield together with the tenure.
- Remember that the numbers say nothing about the money after a shorter deposit matures.
- Remember that tax, TDS and premature withdrawal are not in the figures.
Try the FD Calculator
Enter a rate and a tenure for Option A, then a second rate and tenure under Compare With Another Offer, to see the maturities, the yields and the differences side by side.
Frequently Asked Questions
Why is the longer deposit's maturity larger if its rate is lower?
Because the money stays in for 2 more years, so it earns interest for longer. A larger maturity over a longer tenure is not a like-for-like comparison.
How do I compare two deposits on equal time?
Enter the same tenure for both in the FD Calculator. The maturities then cover the same period, and the difference is more directly comparable.
Does this say which deposit to choose?
No. It states the differences between the numbers entered. Which matters more is your own decision, and tax, withdrawal terms and the bank's own rules are not in the figures.
How were the figures calculated?
With the FD Calculator, using ₹1,00,000, quarterly compounding, 7.1% for 3 years as Option A and 6.8% for 5 years as Option B, then the same two rates over 5 years. You can reproduce them by entering the same values.
Related Articles
Explore more practical guides from ToolZen Hub.