1. One Plan, Three Returns
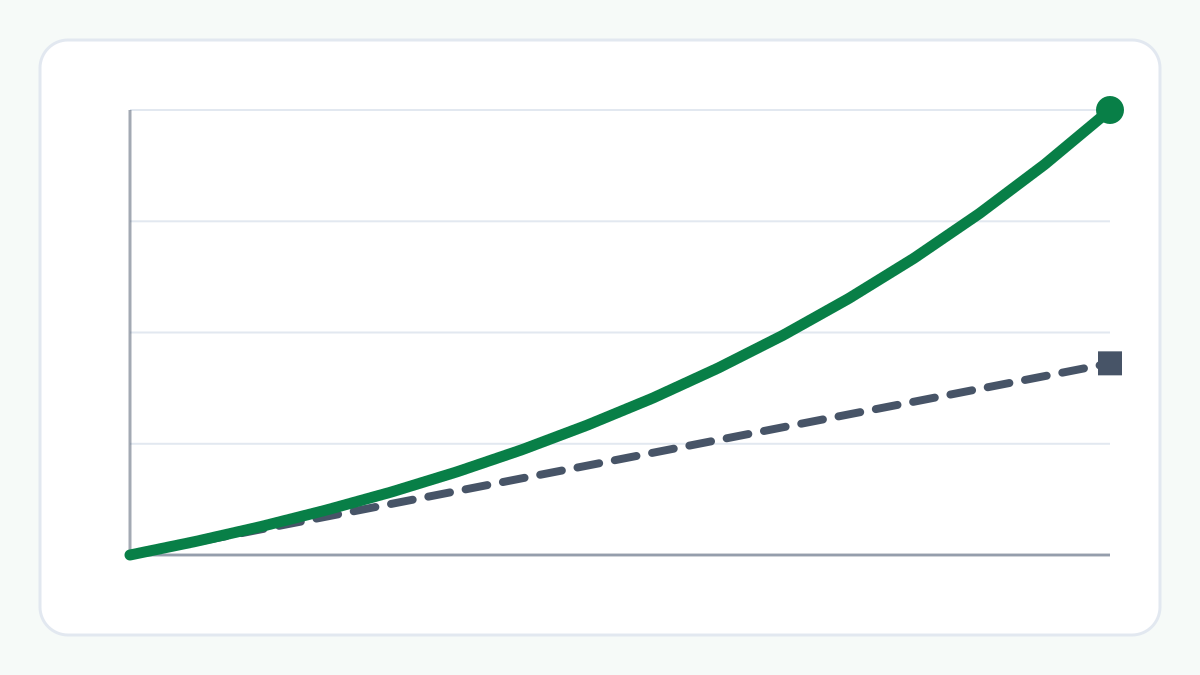
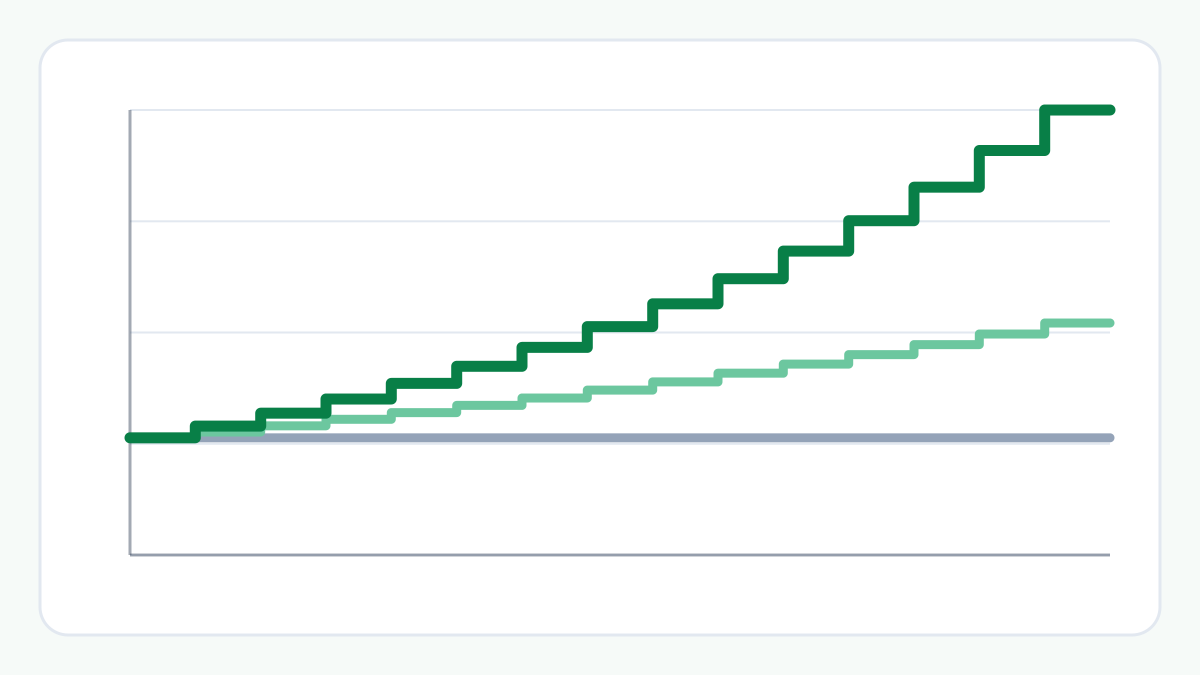
Take a plan of ₹10,000 a month for 15 years. You invest ₹18,00,000 whatever the return turns out to be. Only the estimated growth changes.
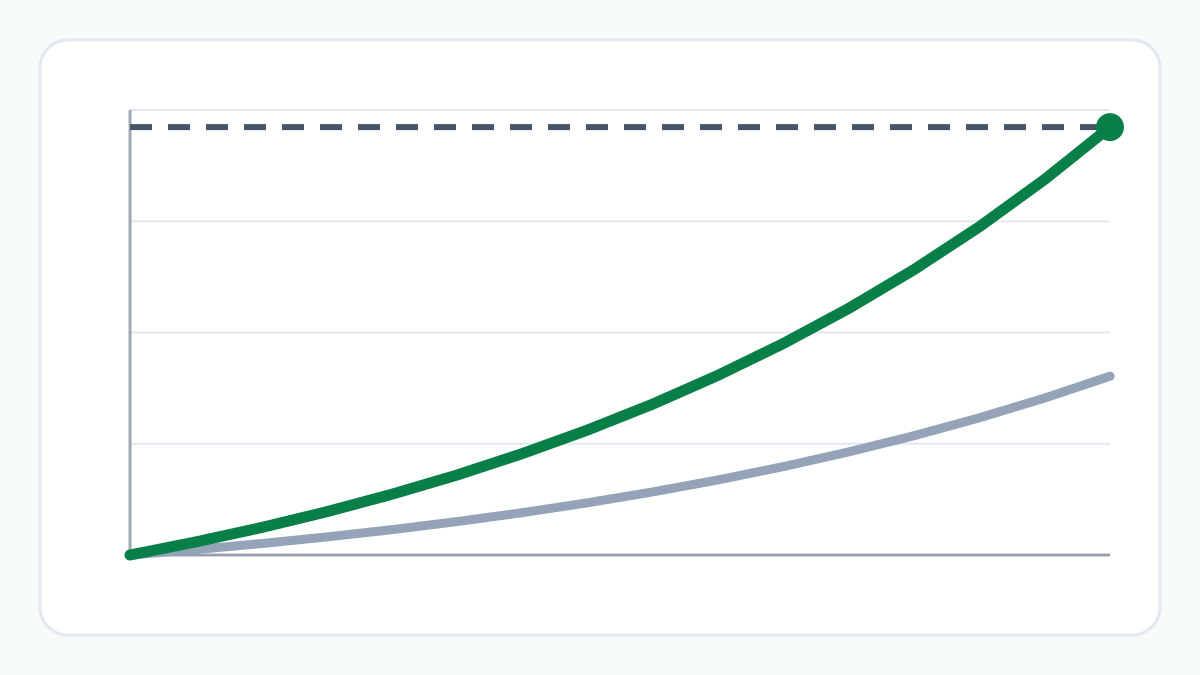
At an assumed return of 8% a year the estimated value is about ₹34,83,451, and the estimated growth about ₹16,83,451. At 10% they are about ₹41,79,243 and ₹23,79,243. At 12% they are about ₹50,45,760 and ₹32,45,760.
2. Why Two Points Matter
Two percentage points sounds small. Applied every month for 15 years, and compounding on a growing balance, it is not. Compared with 10%, an assumed 8% lowers the estimated value by about ₹6,95,791, which is about 17%. An assumed 12% raises it by about ₹8,66,517, about 21%.
The effect is not symmetrical, because compounding gains more from a higher rate than it loses from a lower one of the same size. At 12% the estimated value is about 45% higher than at 8%.
3. Reading a Range
Showing a range makes the uncertainty visible. The SIP Calculator shows your plan at the return you assumed and at two points lower and higher, labelled lower, as assumed and higher.
These are scenarios, not forecasts. They are not a worst case or a best case: actual returns can be below the lowest scenario, above the highest, or negative in some periods. A range helps you see how much of a projection rests on the assumption, which is more useful than treating one figure as the answer.
4. What This Does Not Tell You
The returns here are assumptions chosen to show sensitivity. They are not the returns of any investment, and nothing here says which return to expect. Investments are subject to market risk.
The projections leave out taxes, fund charges, exit loads and inflation. This article gives information, not advice.
Example: ₹10,000 a Month for 15 Years at Three Assumed Returns
In every case you invest ₹18,00,000 in total, with each SIP made at the start of the month and the annual return divided by 12 each month.
At an assumed 8% a year, the estimated value is about ₹34,83,451. At 10% it is about ₹41,79,243. At 12% it is about ₹50,45,760.
The difference between the lower and the higher scenario is about ₹15,62,309, nearly as much as the ₹18,00,000 you invest.
The Bigger Picture
The amount you invest and the period are choices. The return is an assumption, and it moves the result more than most people expect. Looking at a plan at more than one assumed return shows how much of the projection depends on a number nobody can promise.
Things to Consider
- Look at a range of assumed returns, not one.
- Remember that returns can be lower than any scenario, and negative.
- Remember that taxes, charges and inflation are not in the projection.
- Use projections to understand a plan, not to predict an outcome.
- Remember that investments are subject to market risk.
Try the SIP Calculator
The calculator shows your plan at the assumed return and at two points lower and higher, side by side.
Frequently Asked Questions
Which assumed return should I use?
There is no right answer, and this site does not recommend one. The default of 10% is only an example. Try a range, and treat the result as a scenario, not a prediction.
Is the lower scenario the worst case?
No. It is the plan at two points below the return you entered. Real returns can be lower, and can be negative.
Why is a higher return worth more than a lower one costs?
Compounding builds on a growing balance, so each extra point of return adds more than the same point removes. The effect grows with the length of the period.
How were the figures calculated?
With the SIP Calculator, using a standard monthly model: each SIP is invested at the start of the month and the annual return is divided by 12. You can reproduce them by entering the same values.
Related Articles
Explore more practical guides from ToolZen Hub.