1. What Compounding Means
A fixed deposit earns interest at a quoted yearly rate. If the interest is added to the deposit from time to time, the added interest earns interest too. How often that happens is the compounding frequency.
Yearly compounding adds interest once a year. Half-yearly adds it twice, quarterly four times and monthly twelve times. In each case the interest added is the quoted rate divided by the number of periods in the year, so the quoted rate is the same under all four.
2. One Deposit, Four Frequencies
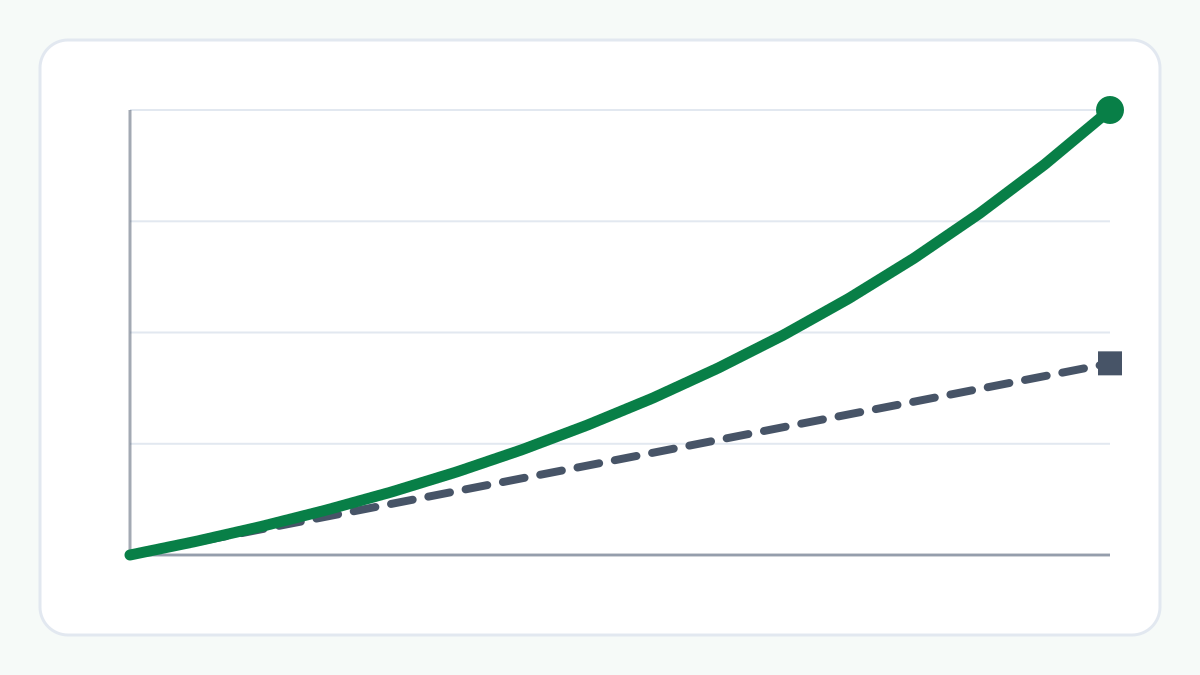
Take ₹1,00,000 at a quoted 7% a year for 5 years. With yearly compounding it matures to ₹1,40,255.17. With half-yearly compounding it matures to ₹1,41,059.88, with quarterly compounding to ₹1,41,477.82 and with monthly compounding to ₹1,41,762.53.
Each step to a more frequent schedule adds a little less than the one before: ₹804.70 from yearly to half-yearly, ₹417.94 more to quarterly and ₹284.71 more to monthly.
3. The Quoted Rate and the Yield
The effective annual yield is what one year grows to under a given compounding. It turns the four schedules into comparable yearly rates: 7.0000% for yearly, 7.1225% for half-yearly, 7.1859% for quarterly and 7.2290% for monthly.
It is not the quoted rate, which stays 7%, and it is not the growth over the whole 5 years, which is 40.26% for yearly compounding and 41.76% for monthly. With yearly compounding the yield equals the quoted rate.
4. How Big Is the Difference?
Monthly instead of yearly compounding adds ₹1,507.35 on this deposit over 5 years. For scale, a quoted rate 0.4 points higher, 7.4% compounded quarterly, matures to ₹1,44,284.83, which is ₹2,807.01 more than 7% compounded quarterly.
So the frequency matters, and it is usually smaller than a difference in the quoted rate. These figures hold for this deposit and these rates only.
5. What This Does Not Tell You
Not every deposit offers every frequency, and the schedule is set by the bank and the product. A more frequent schedule is not a reason to choose a deposit: this article does not compare products or say which to take.
The figures assume the rate stays the same and the interest stays in the deposit. A bank's own maturity can differ, because banks use their own compounding dates, day-count conventions and rounding. Tax and TDS, premature withdrawal, payout options and deposit insurance are not included.
Example: ₹1,00,000 at a Quoted 7% a Year for 5 Years
Yearly: ₹1,40,255.17, yield 7.0000%. Half-yearly: ₹1,41,059.88, yield 7.1225%. Quarterly: ₹1,41,477.82, yield 7.1859%. Monthly: ₹1,41,762.53, yield 7.2290%.
Monthly instead of yearly adds ₹1,507.35. A quoted 7.4% compounded quarterly matures to ₹1,44,284.83, ₹2,807.01 more than 7% quarterly.
The Bigger Picture
A quote is two numbers: the rate and how often it is compounded. Looking at the effective annual yield next to the maturity makes two quotes with different schedules comparable, without treating either number as the whole answer.
Things to Consider
- Read the rate and the compounding together.
- Use the effective annual yield to compare quotes with different schedules.
- Remember that the frequency is set by the bank and the product.
- Remember that tax, TDS and premature withdrawal are not in the figures.
Try the FD Calculator
Enter a deposit, a rate and a tenure, then switch the compounding between monthly, quarterly, half-yearly and yearly to see the maturity and the effective annual yield change.
Frequently Asked Questions
Does more frequent compounding change the quoted rate?
No. The quoted rate stays the same. More frequent compounding adds interest in smaller steps, so the interest earns interest sooner and the effective annual yield is slightly higher.
Is the effective annual yield the same as the total return?
No. The yield is what one year grows to. The total growth is for the whole tenure, and it is a different figure.
Will my bank's maturity match these figures?
Not necessarily. Banks use their own compounding dates, day-count conventions, rounding and product terms. These are calculations from the numbers shown, not a bank's quote.
How were the figures calculated?
With the FD Calculator, using a deposit of ₹1,00,000, a quoted rate of 7% a year, a tenure of 5 years and each compounding choice in turn. You can reproduce them by entering the same values.
Related Articles
Explore more practical guides from ToolZen Hub.