1. One Month of a Plan
Take a corpus of ₹1 crore, a withdrawal of ₹80,000 a month and an assumed return of 8% a year. The calculator treats 8% as an effective annual rate, which works out to about 0.6434% a month.
In month 1 the withdrawal is taken first, so the corpus drops from ₹1,00,00,000 to ₹99,20,000. Only that smaller balance then receives the month's modeled growth, about ₹63,826. The closing balance is about ₹99,83,826, and month 2 starts from there.
Every period follows the same order: opening balance, withdrawal out, remaining balance, modeled growth added, closing balance. The year-by-year table in the calculator is this cycle repeated and added up for each year.
2. Why Withdrawals Can Exceed the Corpus
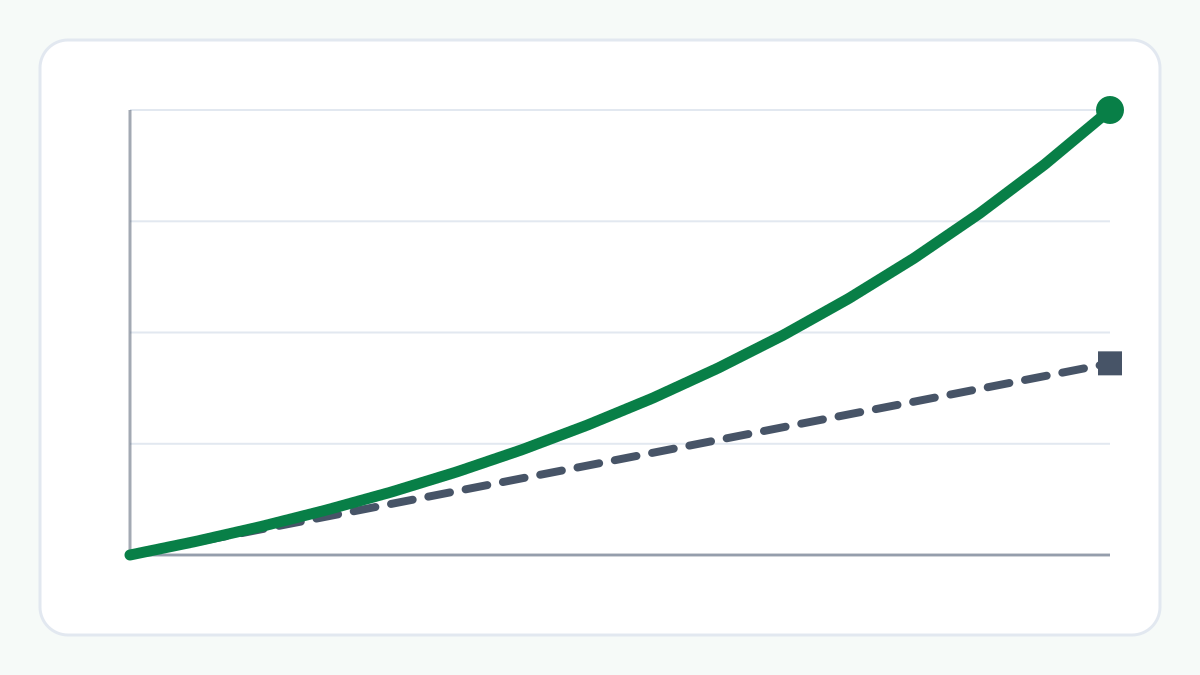
Withdrawing ₹80,000 a month for 25 years adds up to ₹2,40,00,000. Yet at an assumed 8% the corpus that plan needs at the start is about ₹1,06,86,635, less than half of that.
The difference is modeled growth. Money that has not been withdrawn yet is assumed to keep earning the return, so about ₹1,33,13,365 of the ₹2,40,00,000, roughly 55%, comes from growth in this model and the rest comes from the corpus itself.
That growth is an assumption. If the return were lower, the same corpus would pay out less in total and the plan would be used up sooner.
3. When a Corpus Lasts and When It Does Not
Each month the balance rises or falls depending on whether that month's modeled growth is larger or smaller than the withdrawal. On ₹1 crore at an assumed 8%, the two are equal at a withdrawal of about ₹63,929 a month. Below that, growth is larger than the withdrawal and the balance does not fall. Above it, the balance falls, gradually at first and then faster, because a smaller balance earns less growth.
A withdrawal of ₹80,000 is well above that level, and the corpus is used up after 20 years 10 months. A withdrawal of ₹60,000 is below it, and in the model the balance is still ₹3,82,10,449 at the calculator's 50-year limit, more than the ₹1 crore it began with.
That level moves with the corpus and the return. It is a feature of the arithmetic, not a target and not a suggested withdrawal.
4. Three Questions, One Model
The calculator's three questions are the same model run in different directions. "How long will my corpus last?" fixes the corpus and the withdrawal and repeats the cycle until a withdrawal can no longer be paid in full. "How much can I withdraw?" fixes the corpus and the number of years and finds the first withdrawal that uses the corpus up at the end. "What corpus do I need?" fixes the withdrawal and the years and finds the starting corpus.
On one set of assumptions they agree with one another. ₹1 crore with an ₹80,000 withdrawal lasts 20 years 10 months. Over 25 years instead, the same ₹1 crore supports a first withdrawal of ₹74,859 a month (the calculator rounds a withdrawal down), and an ₹80,000 withdrawal for 25 years needs about ₹1,06,86,635. The last two answers describe the same fact from two sides: ₹80,000 a month is more than ₹1 crore can pay for 25 years, and ₹1,06,86,635 is what it would take.
5. Where a SIP Fits
A SIP and an SWP are the same kind of arithmetic pointed in opposite directions. A SIP adds money to a corpus on a schedule, and an SWP takes money out on a schedule. Both rest on an assumed return, which is why neither result is a forecast.
One practical difference is that the SWP Calculator treats the annual return as an effective annual rate, while the SIP Calculator divides the annual rate across the months. Figures from the two should not be mixed as if they used the same convention.
6. What This Does Not Tell You
The return in these examples is one constant assumption. Real returns vary from year to year and can be negative, and a poor run early in a plan can use a corpus up sooner than a steady return suggests. This model does not include that.
Taxes, fund charges, exit loads and inflation are not included either, and nothing here says how much you should withdraw or how a corpus should be invested. Investments are subject to market risk. This guide gives information, not advice.
Example: ₹1 Crore, ₹80,000 a Month, an Assumed 8%
Each withdrawal is taken at the start of the month, and the annual return is treated as an effective annual rate.
Month 1: opening balance ₹1,00,00,000, withdrawal ₹80,000, remaining balance ₹99,20,000, modeled growth about ₹63,826, closing balance about ₹99,83,826.
The same plan lasts 20 years 10 months. Over 25 years, ₹80,000 a month needs about ₹1,06,86,635, and ₹1 crore supports ₹74,859 a month.
The Bigger Picture
A withdrawal plan is a balance moving through the same cycle every period. Seeing which part is withdrawal and which part is modeled growth makes any result easier to read, and shows why a small change in one assumption can matter.
Things to Consider
- Read each result as a scenario based on the inputs, not as a forecast.
- Look at how much of the total withdrawn comes from modeled growth rather than from the starting corpus.
- Remember that the return is an assumption and real returns vary.
- Remember that taxes, charges and inflation are not in the model.
- Remember that investments are subject to market risk.
Try the SWP Calculator
Enter your own corpus, withdrawal and assumed return to see how long a plan could last, what it could withdraw or what corpus it would need, with the year-by-year table behind each answer.
Frequently Asked Questions
Why is the withdrawal taken before the growth?
The calculator assumes each withdrawal is taken at the start of its period, so only the balance that is left receives that period's modeled growth. A calculator that takes the withdrawal at the end of the period can give slightly different results.
Why can total withdrawals be more than the starting corpus?
Because the balance that has not been withdrawn yet is assumed to keep earning the return. That growth pays for part of the withdrawals.
If the model says a plan is not used up, will it last?
Not necessarily. It means that at the assumed constant return the balance does not run out within the calculator's 50-year limit. Real returns vary, so a real outcome can differ.
How were the figures calculated?
With the SWP Calculator, using its standard model: each withdrawal is taken at the start of the period and the annual return is treated as an effective annual rate. You can reproduce them by entering the same values.
Related Articles
Explore more practical guides from ToolZen Hub.